VOLUMETRIC EXTRACELLULAR DNA-TRAP ANALYSIS

See the structure
behind the signal.

Nebulum preserves intact extracellular DNA traps from whole blood and resolves their architecture, molecular localization and cellular interactions in three dimensions.
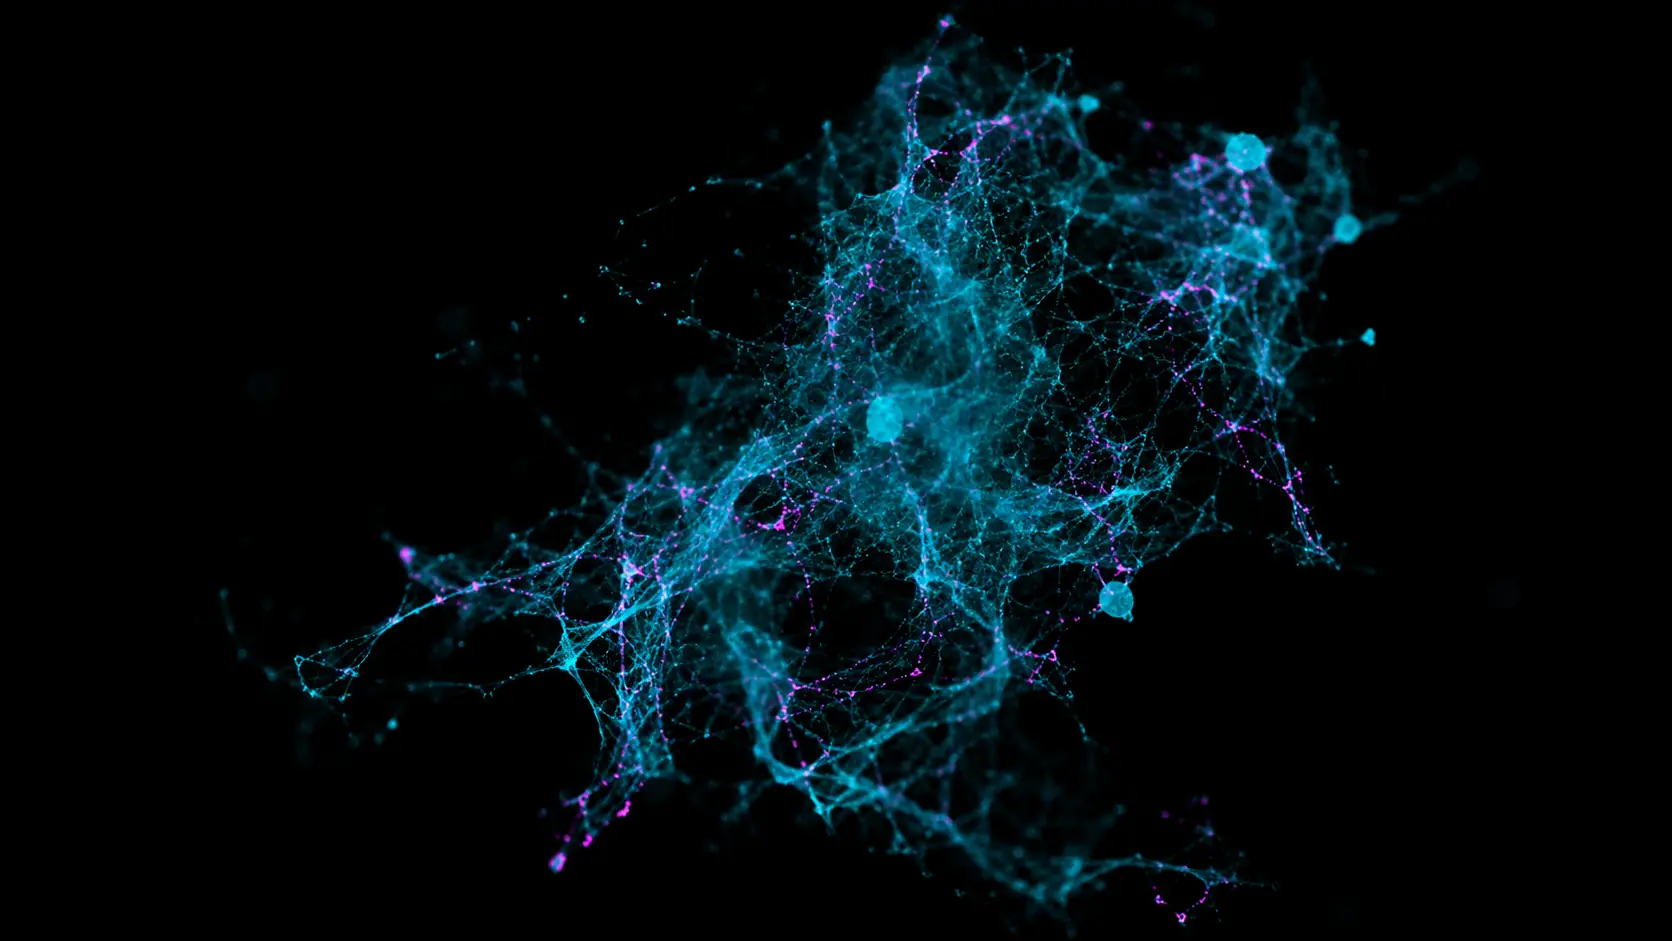
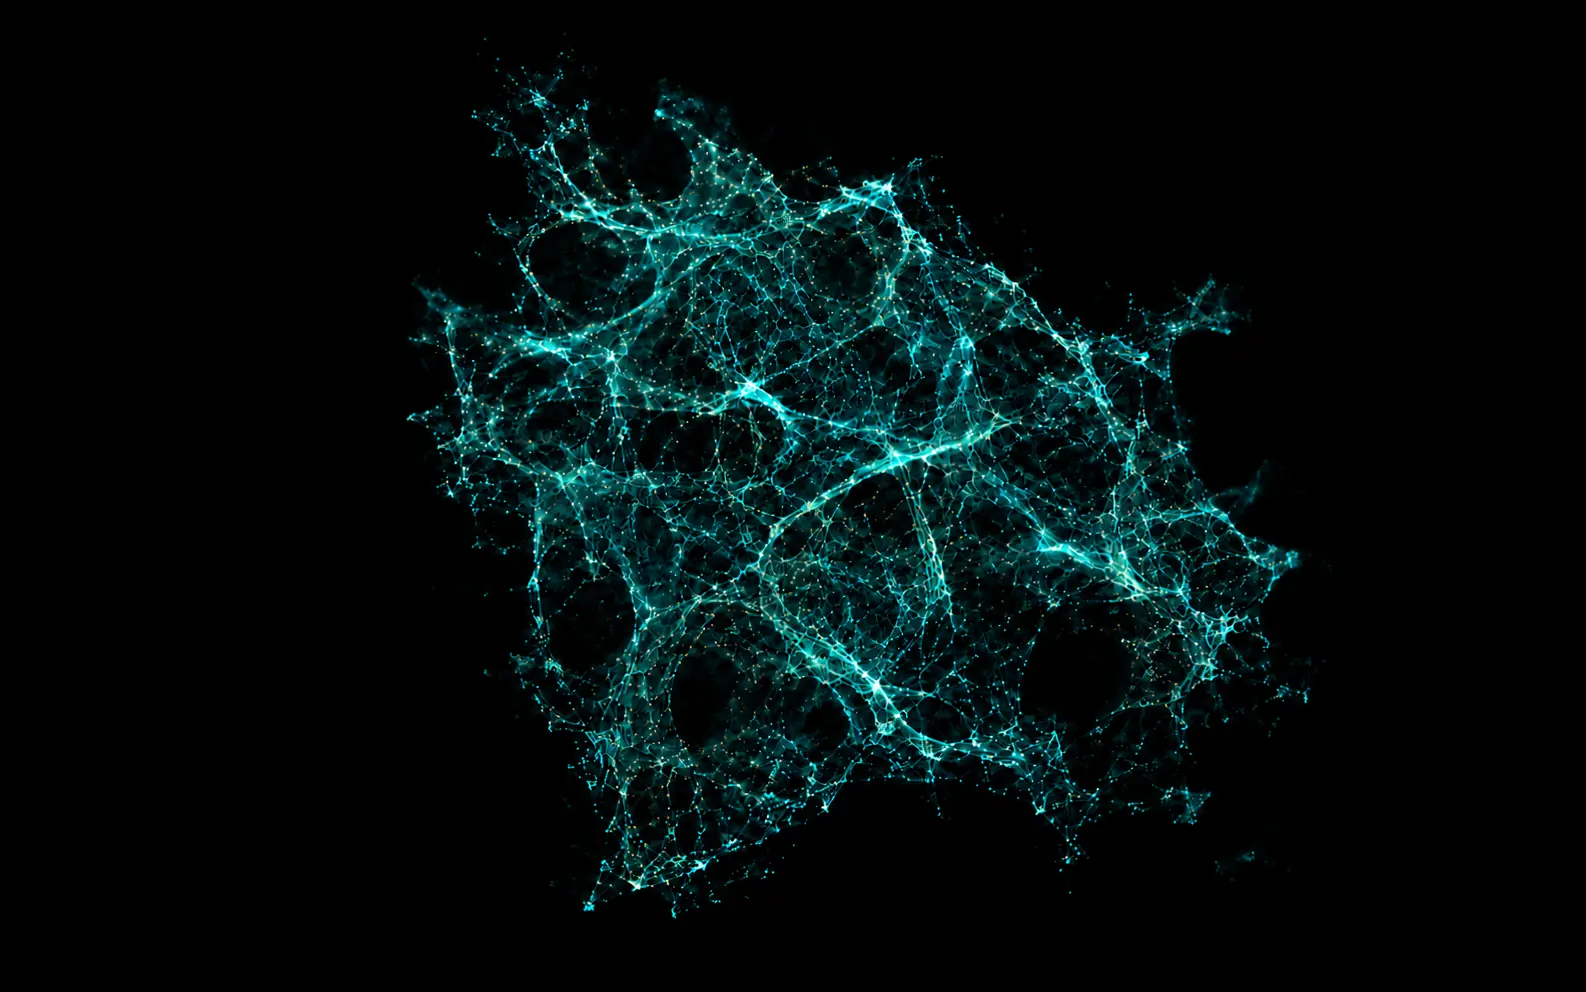
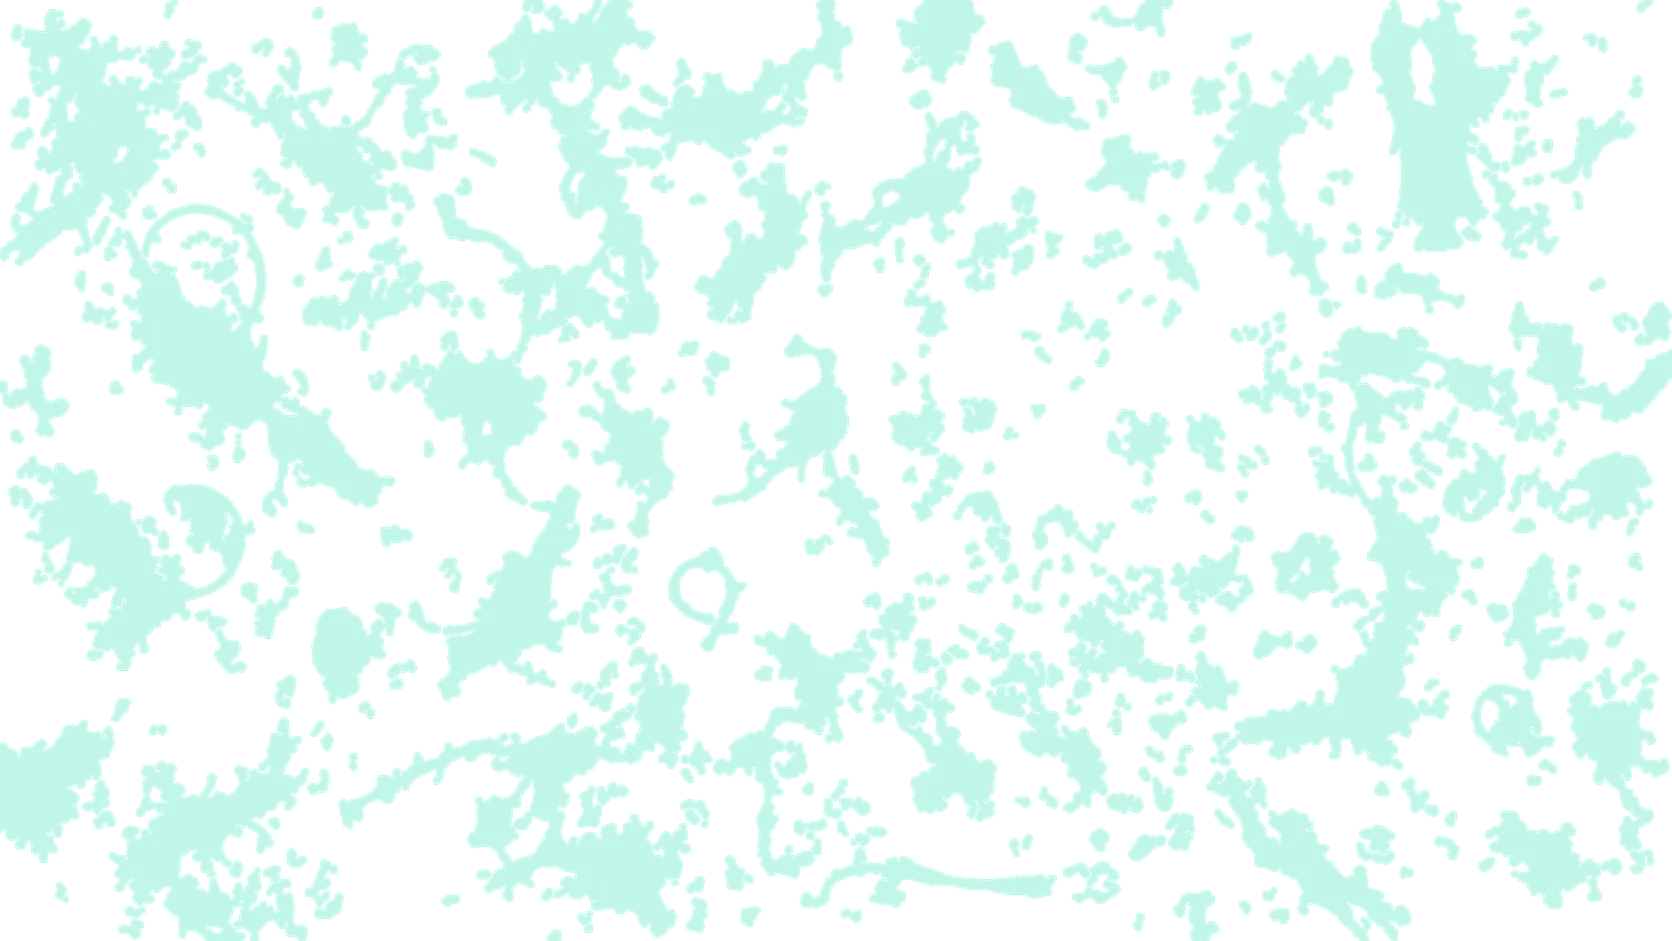
Platform visualization of an intact extracellular DNA-trap volumePLATFORM VISUALIZATION · EXTRACELLULAR DNA-TRAP VOLUME
WHOLE-BLOOD PRESERVATIONHIGH-DENSITY 3D CAPTUREMULTIPLEX PHENOTYPINGOBJECT-LEVEL QUANTIFICATION
ONE EVENT · EVERY SCALE OF DISCOVERY

From one optical plane
to the complete capture.

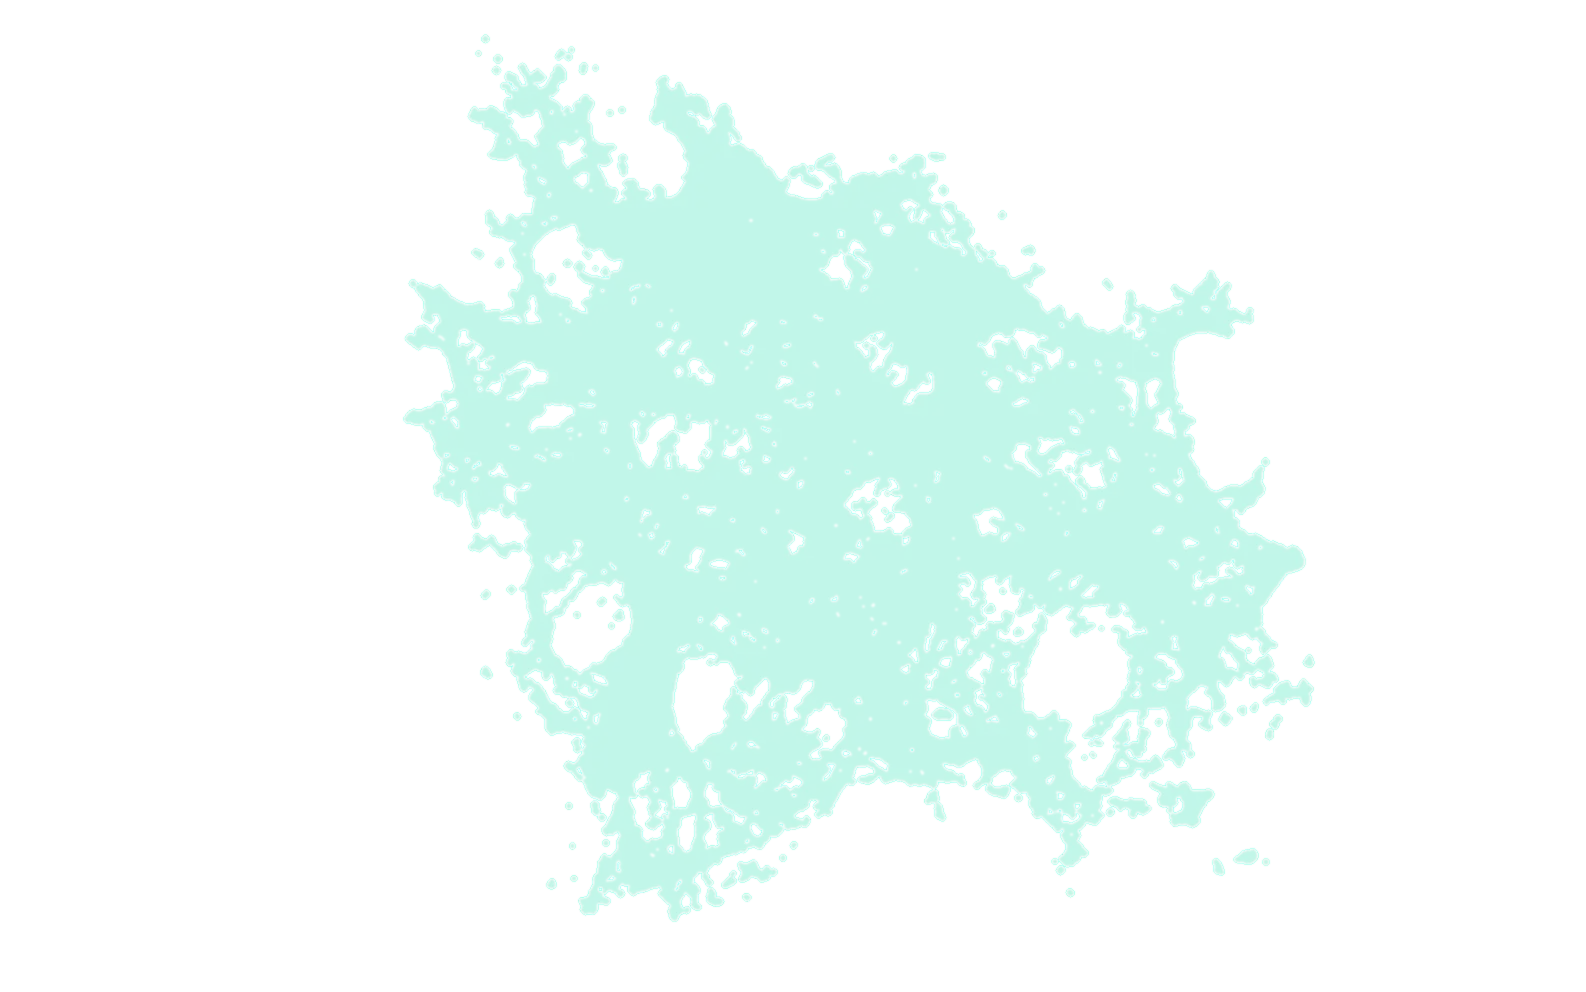
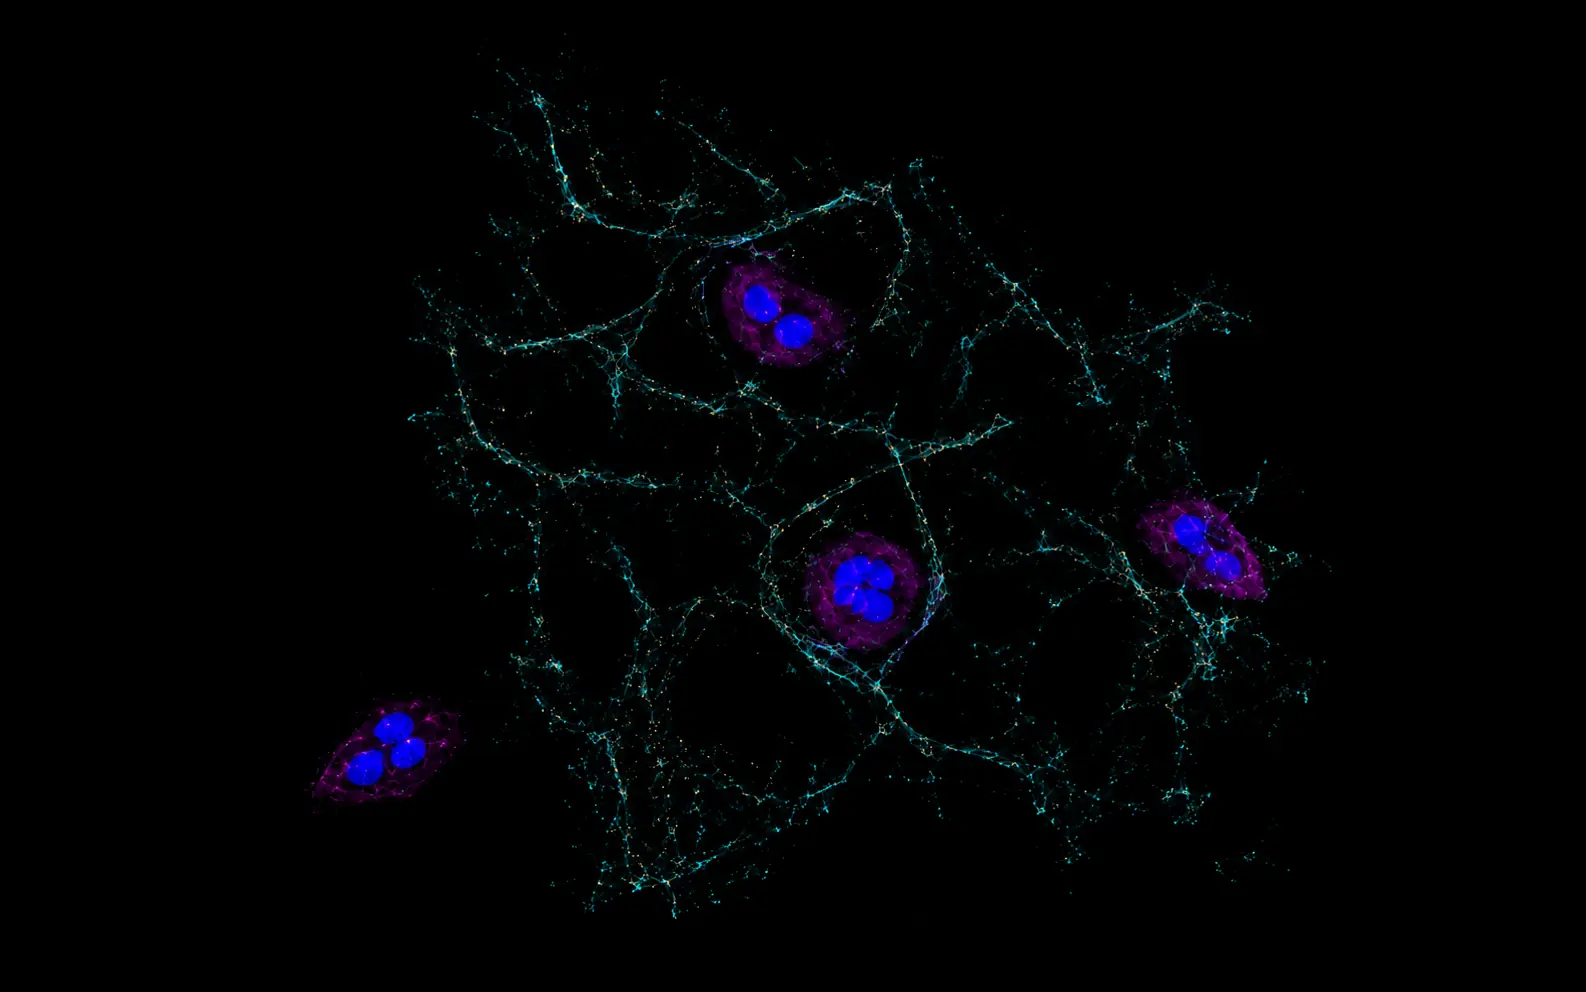
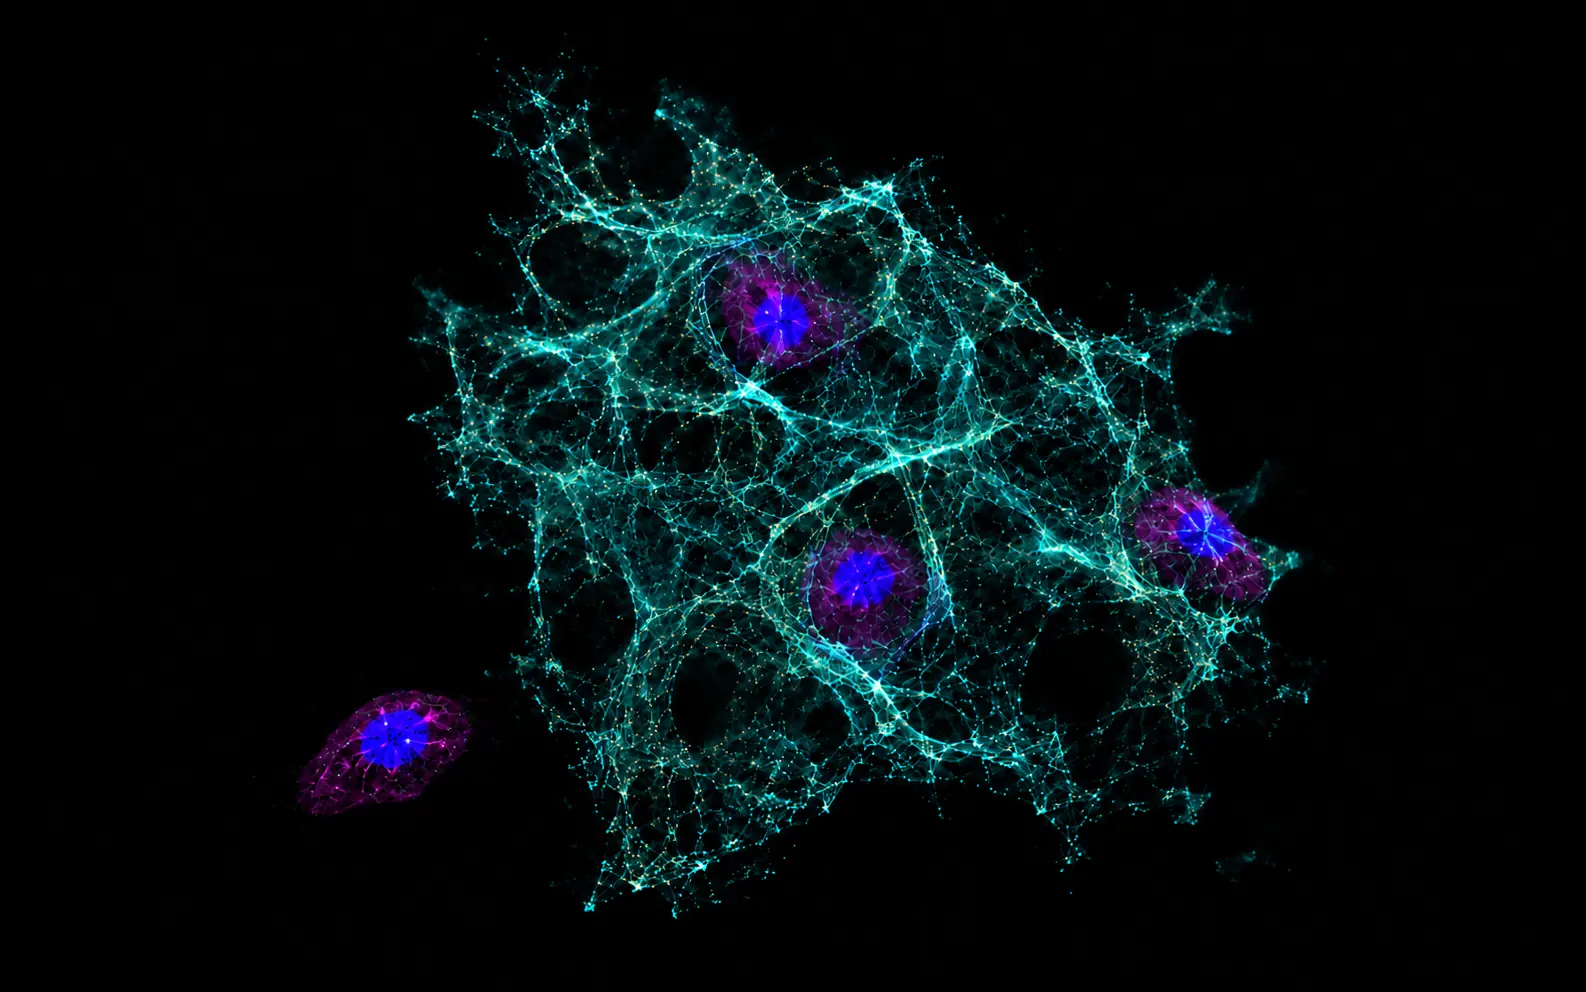
Serial optical sections reconstruct an intact event before the view expands into the complete matrix—connecting local biology with population-scale context.
PLATFORM VISUALIZATION · ONE EVENT, EVERY SCALESINGLE OPTICAL PLANE
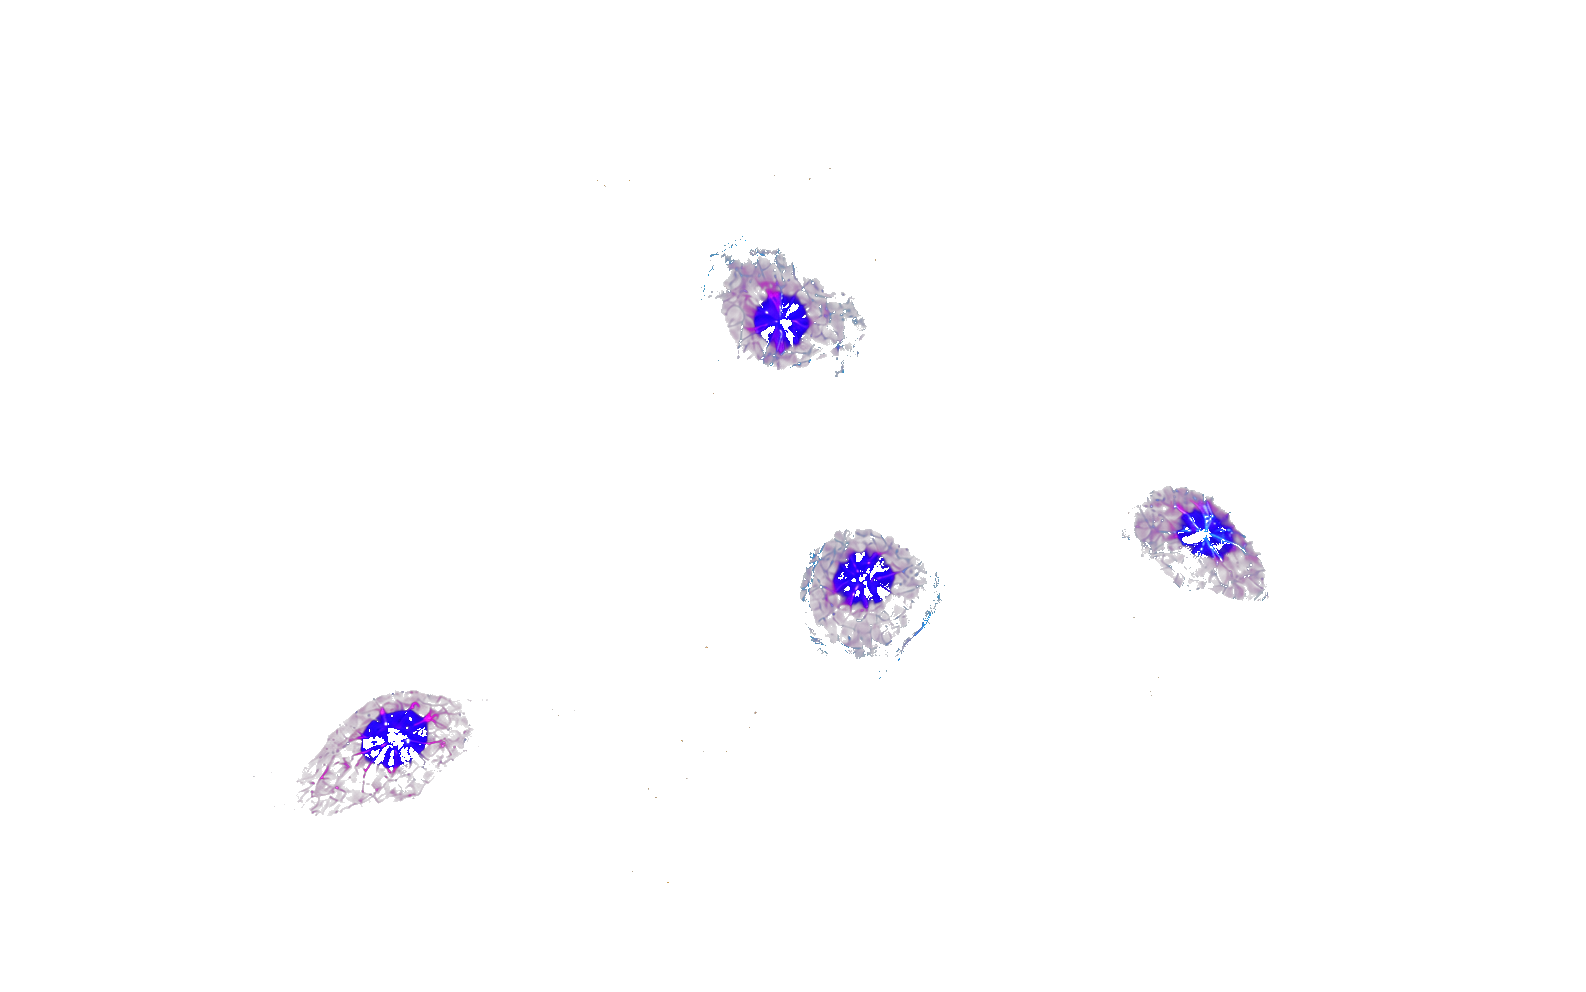
Conceptual single optical section through the same extracellular DNA-trap volume shown in the reconstructionConceptual reconstruction of an intact depth-resolved extracellular DNA-trap volume with spatially associated cellsConceptual rendering of the same trap architecture with the cellular channels removedConceptual whole-matrix view containing many extracellular DNA-trap events
TARGET-ASSOCIATED SIGNAL
CELLULAR CONTEXT
01 · OPTICAL SECTION
Begin at a defined depth

A single optical plane isolates local structure and segmented nuclear morphology within the captured event.

BIOLOGICAL QUESTIONS · BUILT INTO THE ASSAY

From a captured structure
to a development decision.

Configure the marker panel and collection timepoints around the mechanism your program needs to resolve.

01 · STRUCTURAL RESPONSE

Did treatment clear the trap?

Compare longitudinal burden, event count, size and morphology to identify residual intact structures.

BURDENSIZEMORPHOLOGY
02 · CELL–TRAP INTERFACE

What changes when immune cells encounter it?

Map enclosed, contacting and adjacent cells together with study-selected identity and state markers.

IDENTITYCONTACTSTATE
03 · CHECKPOINT CONTEXT

Where is immune suppression localized?

Localize PD-L1 to trap structures and phenotype interacting cells with markers such as PD-1, CTLA-4 or TIM-3.

PD-L1 · TRAPPD-1 · CELLCTLA-4 · CELL

Preserve the structure.
Interrogate the biology.

One coordinated workflow converts a whole-blood specimen into a quantitative, three-dimensional structural endpoint.
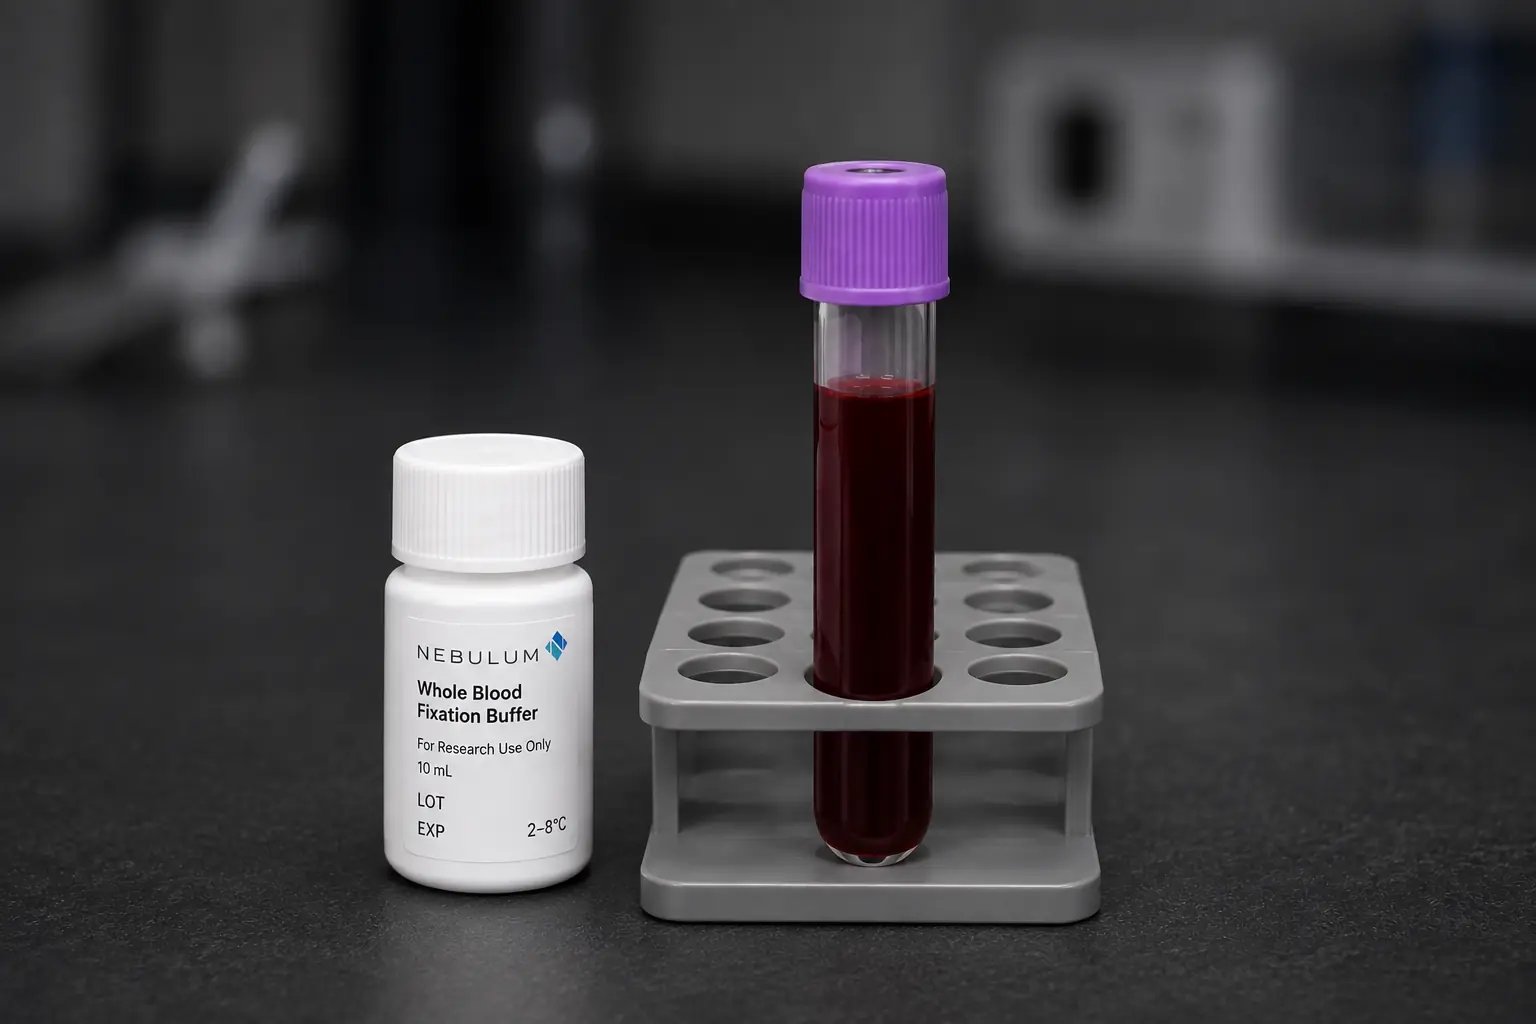
Visualization of whole-blood preservation at collection01
PRESERVE

Stabilize the biological moment.

Whole blood is preserved at collection so fragile extracellular DNA structures reach analysis with minimal ex vivo distortion.

OUTPUT · Stabilized whole blood
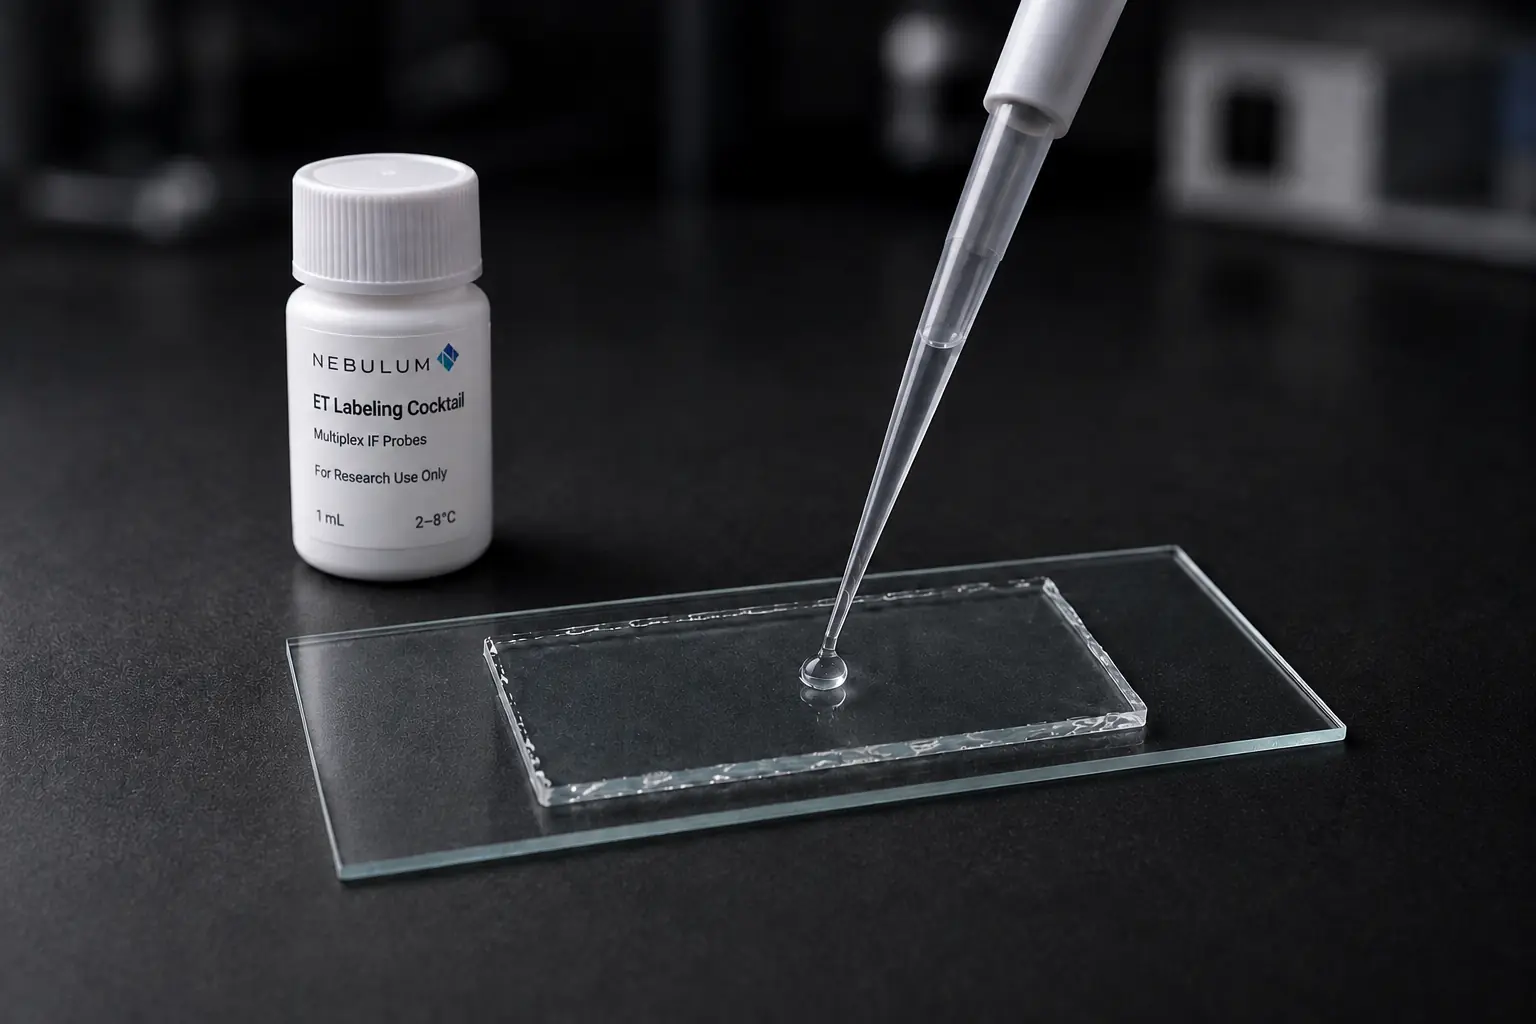
Visualization of a labeled hydrogel specimen on a microscope slide02
COMPACT + LABEL

Concentrate rare structures.

The retained fraction is assembled into a thin, optically accessible matrix and labeled with a study-specific marker panel.

OUTPUT · Target-labeled 3D specimen
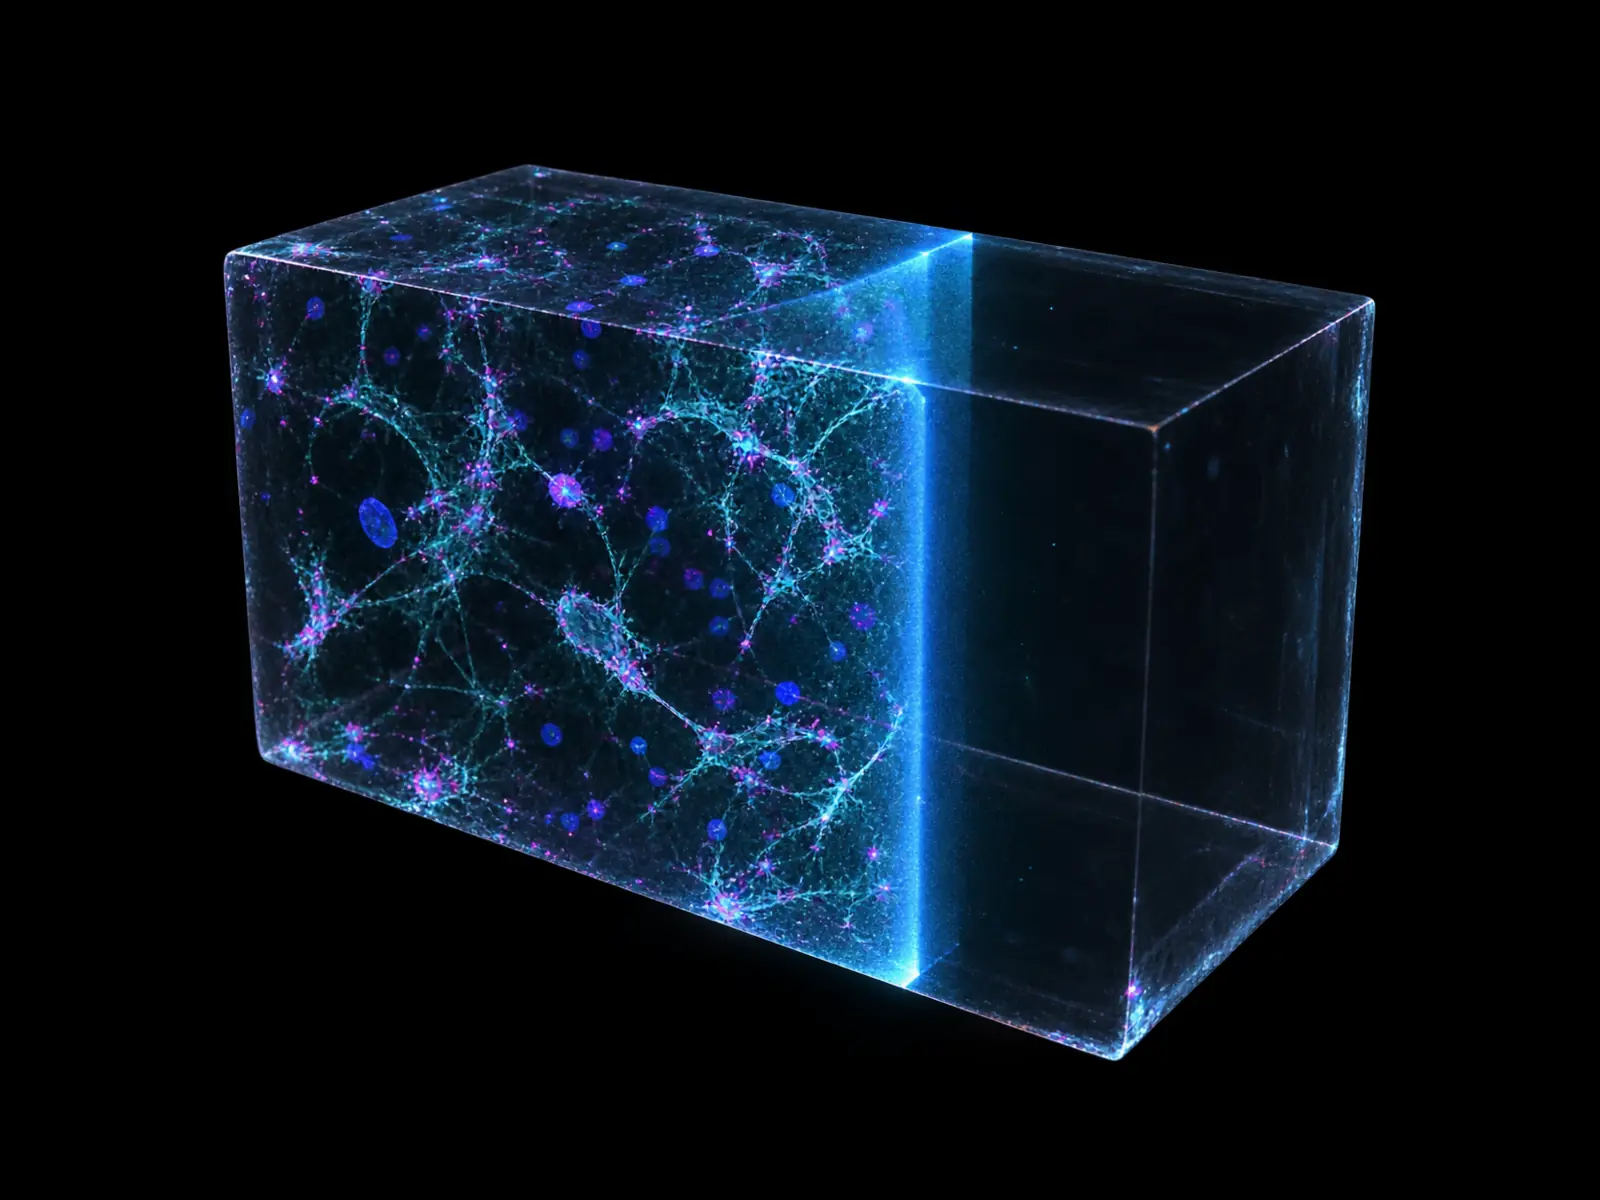
Visualization of volumetric fluorescence acquisition03
IMAGE

Capture the complete volume.

Light-sheet or confocal acquisition resolves intact events plane by plane throughout the three-dimensional specimen.

OUTPUT · Volumetric fluorescence dataset
Registered whole-matrix extracellular DNA-trap segmentation and quantitative outputs04
QUANTIFY

Turn structure into an endpoint.

Object-level analysis reports burden, morphology, molecular localization and cell–trap relationships.

OUTPUT · Structural phenotype profile
ONE SPECIMENPRESERVE → COMPACT → IMAGE → QUANTIFYONE STRUCTURAL DATASET

See what clears.
See what remains.

MATCHED HUMAN OBSERVATIONS

Treatment-linked structural change, resolved directly in circulation.

01 / LONGITUDINAL RESPONSESTAGE I CRC · MATCHED CASE

The tumor was removed.
Circulating trap burden fell toward the healthy range.

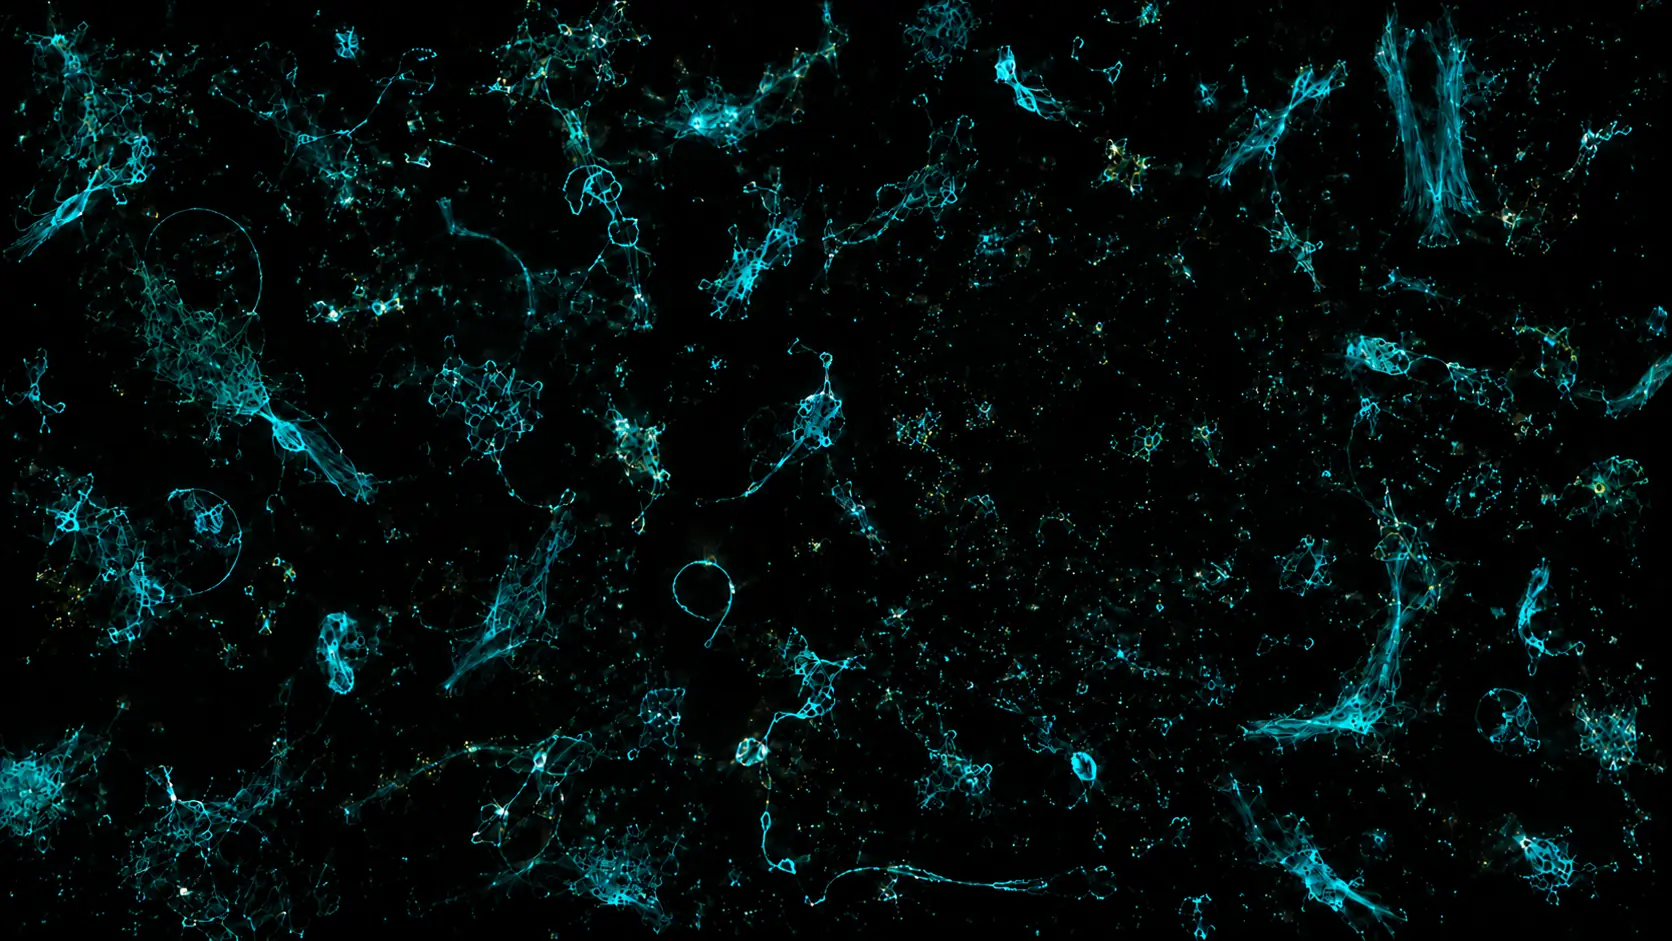
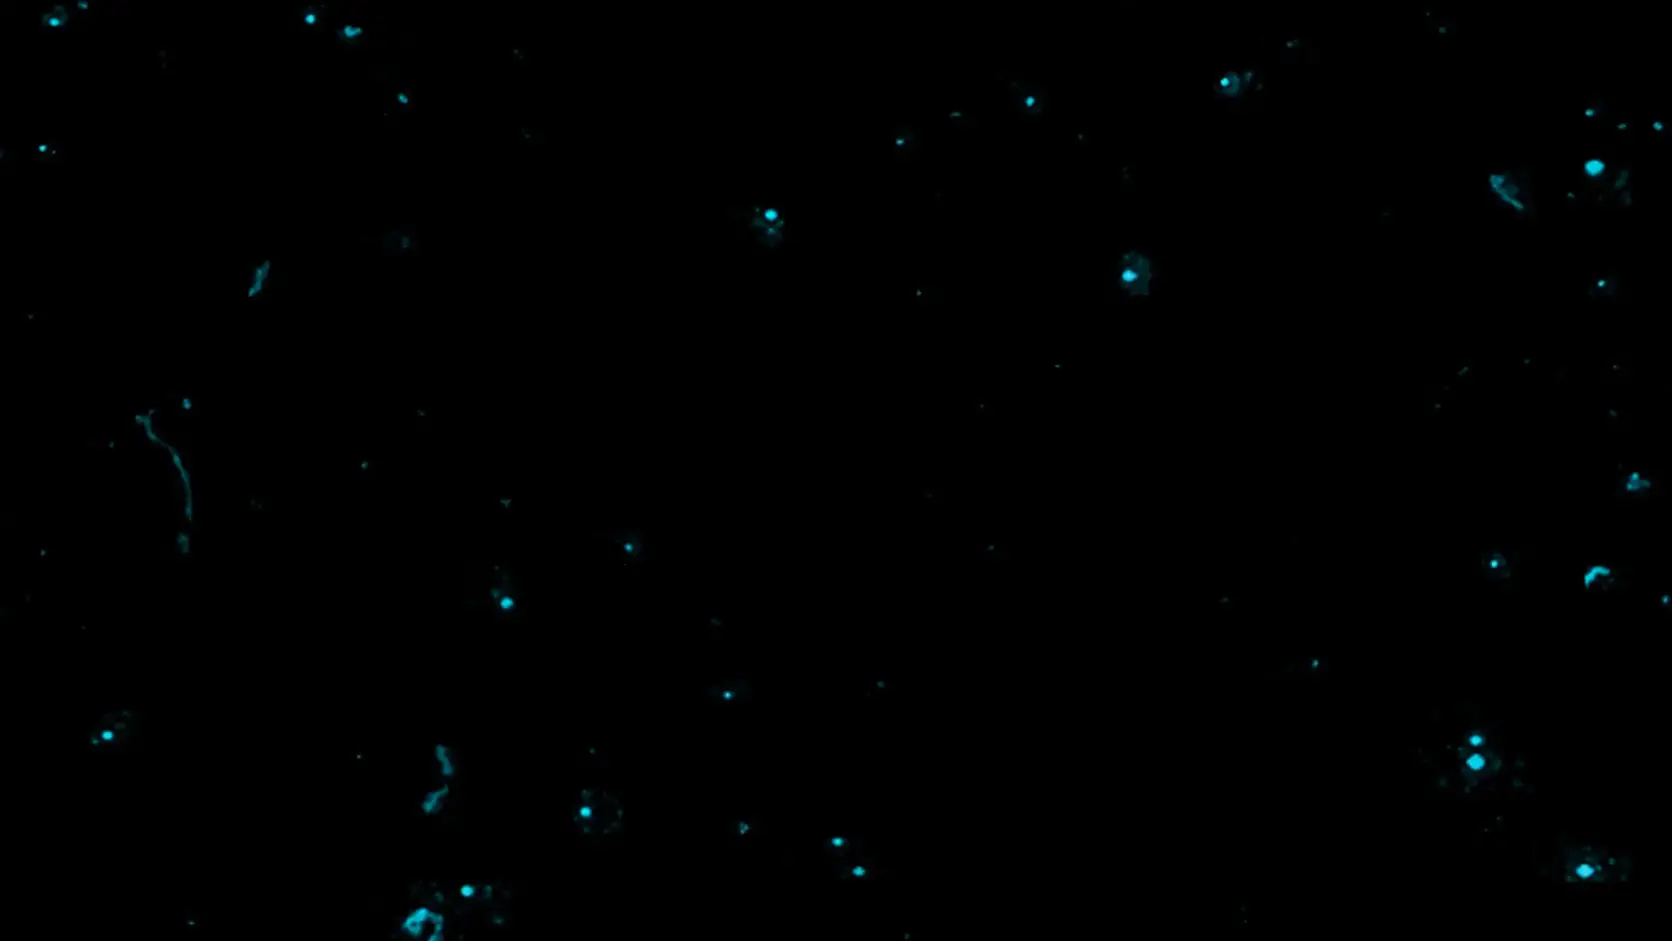
In one exploratory longitudinal case, abundant large extracellular DNA-trap structures before resection were replaced by sparse residual fragments two weeks later.
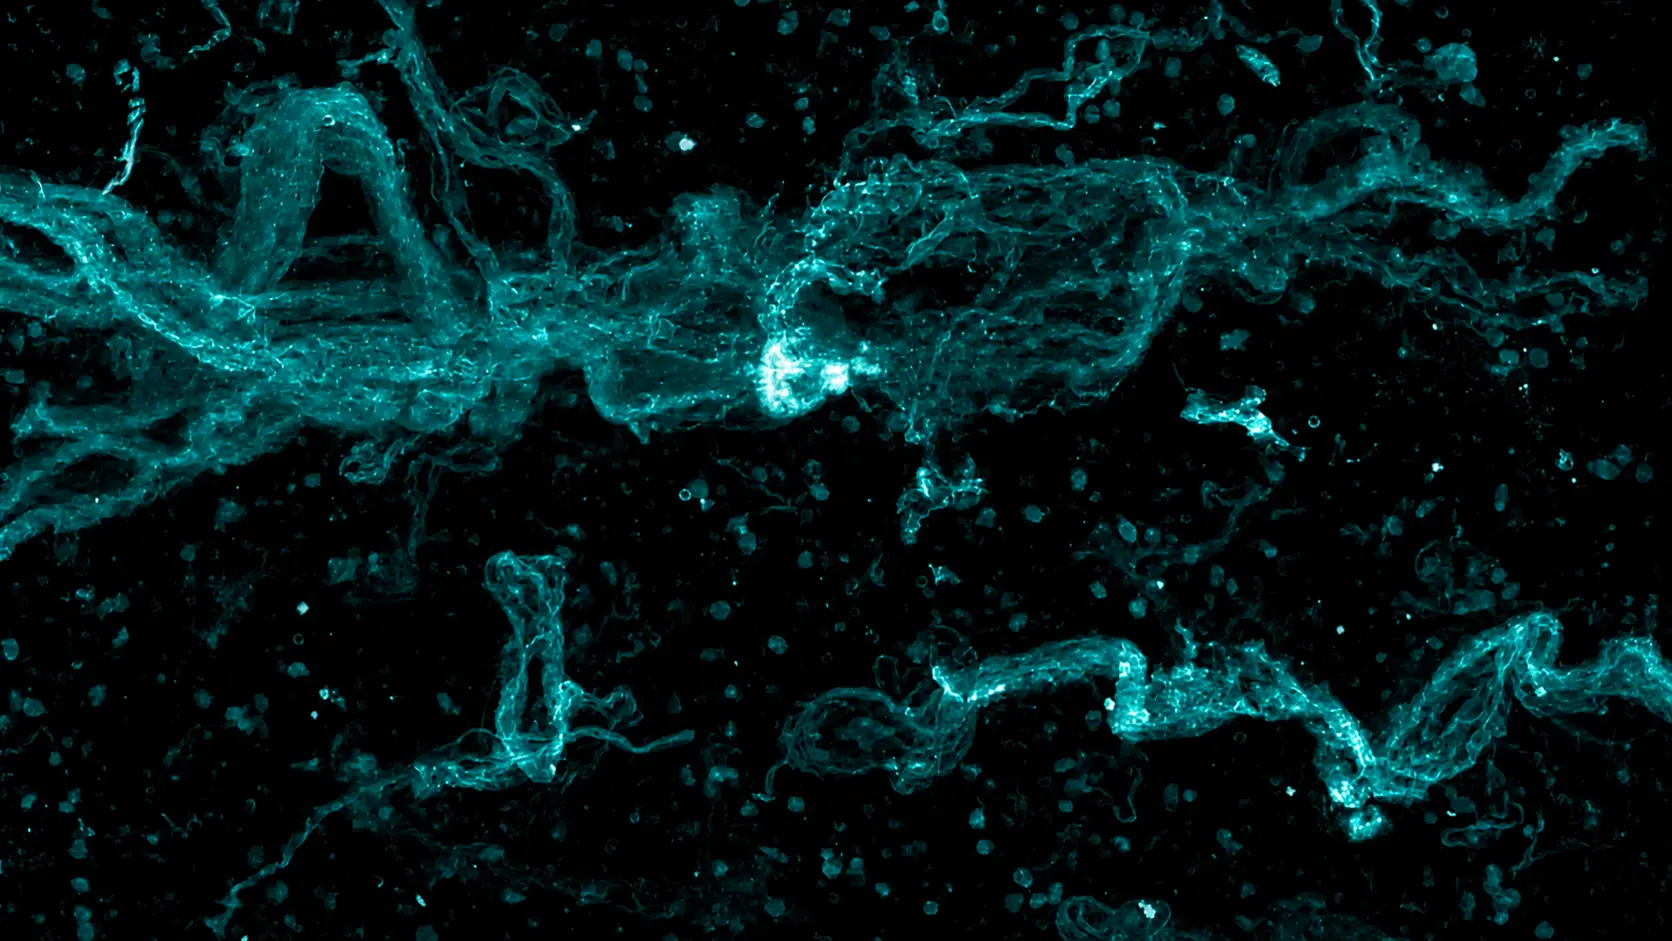
Pseudocolor visualization derived from a representative Stage I colorectal cancer blood sample before tumor resection, showing abundant large extracellular DNA-trap structuresDISPLAY-OPTIMIZED PSEUDOCOLOR
BEFORE RESECTIONAbundant large structuresMatched blood sample · representative projection
Pseudocolor visualization derived from the matched blood sample two weeks after tumor resection, showing sparse residual fragmentsDISPLAY-OPTIMIZED PSEUDOCOLOR
2 WEEKS AFTER RESECTIONSparse residual fragmentsMatched blood sample · representative projection
OBSERVED CHANGE≈10×LOWER
RELATIVE TRAP BURDENHealthy reference = 1.0
10.0PRE-RESECTION
≈1.02-WEEK FOLLOW-UP
WHY PRESERVE STRUCTURE?A difference emerged in imaging—not in plasma citH3.
STRUCTURE-BASED IMAGINGCRC–healthy separation***
VERSUS
PLASMA citH3No significant separationns
+
EXPLORATORY PILOT COMPARISON

Structure resolved a biological difference that the soluble readout did not.

Intact-event imaging and plasma citH3 measure different biological material. This comparison motivates prospective validation; it is not a formal claim of analytical or clinical sensitivity.
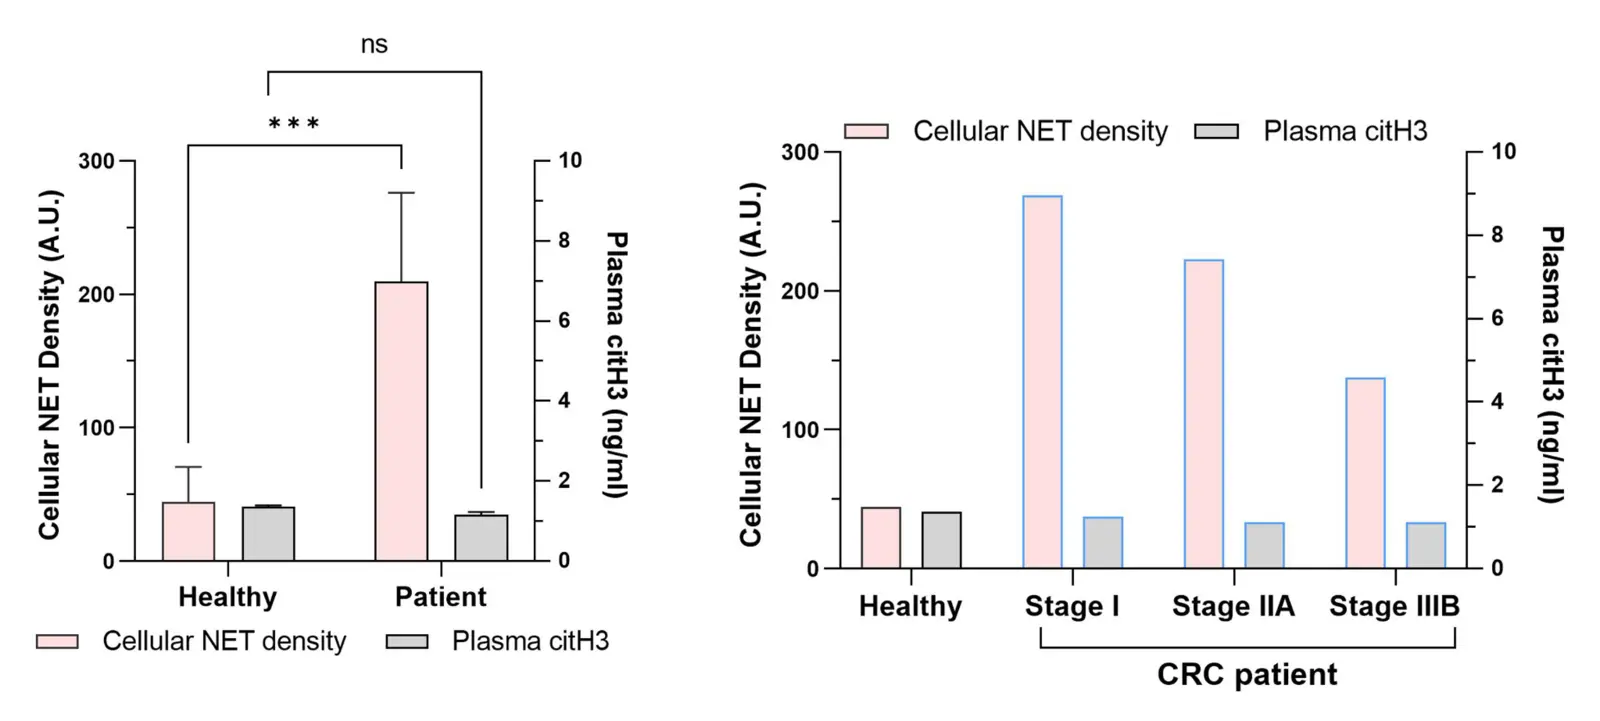
Exploratory comparison of structure-based extracellular trap imaging and plasma citrullinated histone H3 in healthy and colorectal cancer samples
Historical exploratory analysis · Original terminology retained in the source figure
THE STUDY THIS ENABLESCan longitudinal structural burden provide a treatment-responsive endpoint across a prospective colorectal cancer cohort?

Single exploratory longitudinal case · Healthy-normalized legacy analysis · Research use only · Prospective validation required

02 / RESIDUAL BURDENSLE · MATCHED TREATMENT SERIES

Small fragments receded.
Large traps remained.

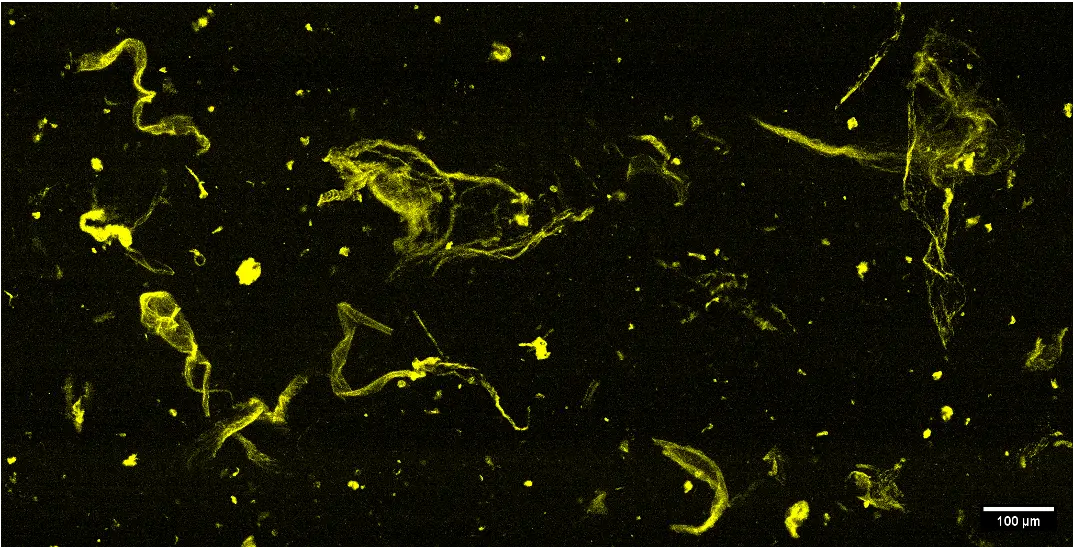
In one exploratory SLE case, the circulating pattern changed after immunosuppressant therapy—but large intact extracellular DNA traps were still visible.
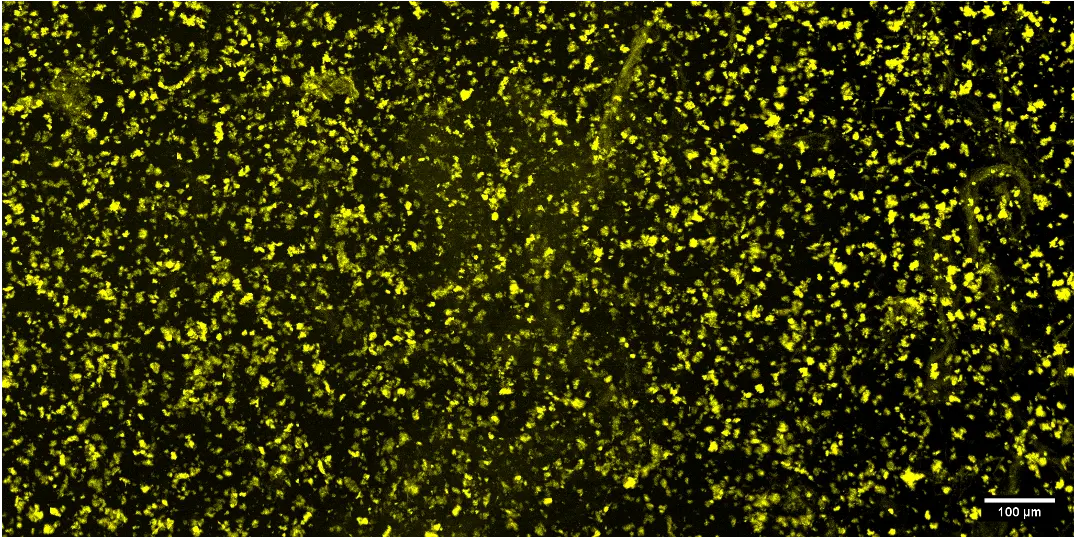
Representative blood-sample projection before immunosuppressant treatment, showing dense extracellular DNA-trap-associated signalDISPLAY PSEUDOCOLOR
BEFORE TREATMENTDense mixed burden
Representative matched blood-sample projection after immunosuppressant treatment, showing fewer small fragments but persistent large extracellular DNA-trap structuresDISPLAY PSEUDOCOLOR
AFTER IMMUNOSUPPRESSANTResidual large structures
RESIDUAL PHENOTYPELARGETRAPS PERSIST
WHAT THIS CASE SHOWSImmunosuppression changed the pattern without eliminating every large circulating structure.
THE NEXT DRUG QUESTIONCan a NET-directed therapy clear the residual structural burden?

Single exploratory case · Representative matched fields · Research use only · No causal or therapeutic inference · Prospective validation required

FROM OBSERVATION TO ENDPOINT

Test whether the structure responds.

CLEARANCEPERSISTENCETARGET LOCALIZATION
Design the study

Representative exploratory observations · Research use only · Prospective cohort validation required

SELECTED SCIENTIFIC CONTEXTWhy intact trap biology may matter to therapeutic response+

From an observed signal
to a prospectively tested endpoint.

A focused pilot aligns the biological hypothesis, collection plan and structural analysis with the decision your development program needs to make.

01
Define the hypothesis

Indication, therapy, cohort, timepoints and the structural signal to test.

02
Design the measurement

Preservation workflow, marker panel, imaging strategy and quantitative readouts.

03
Deliver the evidence

Registered 3D images, object-level data and a study-level interpretation.

START WITH A FOCUSED PILOT

Have a signal
worth testing?

Bring the samples and therapeutic context. Nebulum will build the measurement strategy around the hypothesis.

YOU PROVIDESamples · treatment context · available outcomes
NEBULUM DELIVERSPreservation · 3D measurement · structured report
Design a pilot with Nebulum

Prefer email? Contact the scientific team. Please do not send patient-identifiable information.